Still a Struggle to Make Money in the South Loop: 1305 S. Michigan
There are thousands of new construction condo units coming on the market all over the South Loop. For those who bought a few years ago, it’s a struggle to compete against the new product and the foreclosure prices now popping up.

In July 2008 we chattered about a 2-bedroom bank-owned unit at 1305 S. Michigan, Unit #1212, that apparently, according to a poster who had checked it out, had “NO appliances, NO toilet, NO cabinets, NO island”.
That listing finally closed.
Unit #1212: 2 bedrooms, 2 baths, no square footage given
- Sold in November 2006 for $389,500
- Foreclosure
- Bank owned and was listed in July 2008 for $329,900 (included the parking)
- Closed in early November 2008 for $285,500 (I’m assuming this also included the parking)
- Assessments of $271 a month
- Taxes of $2941
Some other sellers in the building are struggling to make any profit.
Unit #1703 is a 2-bedroom with 1318 square feet.
Here’s the listing:
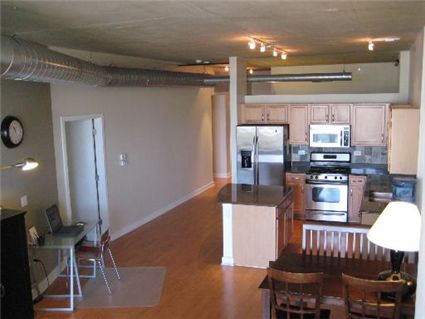
Enjoy loft living in the vibrant South Loop. You’ll love this spacious 2 BR-2BA + office condo with warm gleaming wood floors and fireplace. The open kitchen boasts granite, stainless steel and a stylish slate backsplash.
Hit the spacious balcony after work & watch the sunset to the west with a glass of wine! Great location close to parks, dining and shopping. Parking available for additional $35k. Don’t miss!

Katrina Schmitt at Streeterville Properties has the listing. See more pictures here.
Unit #1703: 2 bedrooms, 2 baths, 1318 square feet
- Sold in August 2006 for $369,500
- Sold in August 2007 for $375,000
- Currently listed for $339,000 plus $35,000 for parking
- Assessments of $388 a month
- Taxes of $4875
What bank in their right mind will finance anybody trying to buy in the South Loop right now? It is only going to take one or two developers to have advertise aggressive closeout pricing on their remaining units and this dam is going to burst.
Sweet ductwork.
Yeah, what is up with the duct through the middle of the living room? Ugly.
I guess being “loft-like” is just an excuse for cheap looking.
I wonder what the difference is between the “12” unit and the “03” unit. Where they face, SQFT, etc.
Just to give you an idea of how bad things are on the Near South Side, which includes the South Loop:
http://lucidrealty.com/near_south_side_market.htm
Look at the second graph. We’re in the process of updating this.
Great information Gary- thanks for posting the link.
What do you think accounts for the big September drop in inventory? Developers/sellers removing units from the market en-masse? Something like Burnham Pointe (or other buildings) being converted into rentals?
That second graph tells the whole story. Any chance you can do a similar one for average prices?
I would guess that the receding inventory is a precursor of the foreclosure tsunami yet to come. Realtors see the futility in wishing prices, and the F***ed Bast**ds (FBs) can only sell on those terms. One by one they disappear underwater, unable to escape to higher ground due to their self-tethered financial anchor. The banks will recover them eventually and auction the remains.
Gary, what do you use for inventory? Is it an average for the month, month-end number, etc?
I have found that new construction distorts market time data in the MLS. It is common for developers’ realtors to enter a unit into the mls only when it gets a contract, which results in a market time of 1 day. The more new construction in the area, the more distortion to the data.
I prefer to track the lisings entered for the month and the ratio of listings entered to sales. It looks like the inventory will rise again based on the November ratio increase.
Here is the data on the South Loop attached (condo/TH) market:
Unit Sales:
Year Sep Oct Nov
2005 91 62 42
2006 157 139 113
2007 74 68 154
2008 82 78 31
Listings Entered:
Year Sep Oct Nov
2005 378 209 149
2006 455 239 162
2007 148 180 258
2008 150 118 88
Listings to Sales ratio:
Year Sep Oct Nov
2005 4.2 3.4 3.5
2006 2.9 1.7 1.4
2007 2.0 2.6 1.7
2008 1.8 1.5 2.8
If new construction distorts average days on market down then things in the South Loop are even worse than the second graph shows (and that ain’t pretty to start with). I don’t really think it can be people just giving up can it? Can it really better for a flipper to go into foreclosure than just sell at a very steep discount?
I’m afraid we are seeing a lot of irrational, things will turn around in the spring behavior. So people are pulling off the market now only to relist in a few months at their same crazy valuations.
Like Sabrina I’d be interested to hear what you think is driving the inventory down Gary.
Tsunami of foreclosures? Not unless the legislature can meddle enough to slow it down….
Mortgage Foreclosure Act
House Bill 2973 (Hamos, D-Chicago; Collins, D-Chicago) may be sent to the Governor on either of the last two days of the 95th General Assembly (Jan. 12, 13, 2009). The House of Representatives must concur in Senate Amendment No. 7, which becomes the bill, for this to happen.
(1) It creates a new section in the Mortgage Foreclosure Act that prohibits a mortgagee from filing a foreclosure complaint unless the requirements of this new Section have been satisfied. It applies only to residential real estate that is the primary residence of the mortgagor and may be used only once per mortgage. It does not apply to mortgages issued or originated on or after the effective d ate of this bill (when the Governor signs it) or if the mortgagor has sought relief under the U.S. Bankruptcy Code.
(2) If a mortgage is delinquent more than 30 days, it requires that the mortgagee send a notice by first-class mail to the mortgagor advising him or her that she may wish to seek housing counseling. No foreclosure action may be instituted before this notice is sent, and legal action is stayed for 30 days after the notice is mailed. The new section details what information must be contained in the notice, and it may be combined with a counseling notification required under federal law. It is to be sent to the common address of the residential real estate secured by the mortgage.
(3) During the 30-day stay after this notice, if an approved housing-counseling agency sends written notice to the mortgagee advising that the mortgagor is seeking its services, it creates another 30 days’ stay after the date of that notice. During this new stay the mortgagor or counselor or both may proffer to the mortgagee a loan-workout plan. If the mortgagee accepts this plan, it prohibits any foreclosure action as long as the mortgagor complies with it. If the mortgagor does not comply with it, the mortgagee may enforce the contract. The plan and any modifications must be in writing and signed by both parties.
(4) Housing-counseling agencies must be approved by the U.S. Department of Housing and Urban Development. It also allows the Secretary of the Department of Financial and Professional Regulation to certify other persons or entities as approved counseling agencies if there are shortages of them in a particular geographic area. But for-profit entities may not be certified to do this.
(5) House Bill 2973 prohibits the parties from waiving any provision of this new section. The General Assembly’s written intent is that compliance with this Section does not prejudice a mortgagee in ratings of its bad-debt collection or calculation standards or policies. This new section is automatically repealed two years from its effective date, which is when the Governor signs it.
“Can it really better for a flipper to go into foreclosure than just sell at a very steep discount?”
Yes, if the “steep discount” required to sell puts them underwater they have no other choice beyond the very slim hope of a short sale.
Or, they can keep feeding the beast.
“So people are pulling off the market now only to relist in a few months at their same crazy valuations.”
Except, fewer and fewer realtors will waste their time with fantasy listings now, let alone in the spring.
Those who choose to feed the beast until spring are guarenteed to increase their losses.
So what is a rational flipper (heh, I made myself laugh with that one) to do?
It would seem the only smart thing to do would be to go to the bank and try get approval for a short sale. If you don’t get it just stop making payments (and taxes and assessments) and wait for the foreclosure to come? Continuing to make your payments until some future time when the market will “get better” certainly is a losing proposition…
Yes, it is. And that short sale will require a lot of work for the right to lose money. Kind of the complete opposite of what these flippers expected, no?
Kind of the complete opposite of what almost everyone expected. According to the resident Ivy League housing analyst it wasn’t supposed to end like this…it wasn’t supposed to be like this….Who would have seen this coming????
Just now getting around to responding. I don’t see anything obvious that explains the drop in months of inventory that occurred in September. However, I do know that it was inventory that dropped as opposed to sales going up. Maybe a year ago it was more new development? Never fear, when we update the graphs today/tomorrow you will see that months of inventory has gotten much worse there.
For data I’m using Agent Metrics which defines inventory as for sale during month – under contract – canceled. If you think about it a while it makes sense.
G, I’m interested in knowing how you got your data. Doesn’t look like something that would be easy to pull from the MLS unless you just happen to collect the data over time.
I don’t normally track median sales prices because I don’t like the skew from types of units sold. However, it’s easy enough for me to post a special link here for 3 bedrooms in the South Loop that really illustrates the problem:
http://sites.google.com/site/lucidrealty/Home/NearSouthPrices.jpg
That should cure anyone from ever looking at median prices again.
Every time I hear some stuck flipper talking about cashing out their 401k or IRA to make house payments I just want to jump through the screen and slap them. Why not be foreclosed on now, go bankrupt and come out of it with the retirement money still intact rather than continue bleeding for a few more months, be foreclosed anyway and be left with absolutely nothing?
Most Americans haven’t a clue as to the difference between secured and unsecured loans and don’t know what is and isn’t protected during bankruptcy.
Gary:
It would be interesting (I think) and more illuminating if that chart included a rolling 3-month median and the median for the full two years. Medians are often deceptive as snapshots, but should be less so over longer periods with larger *n*. If the 2 year median is down under $600k, and the 3-month average goes all over the place, it would emphasize your point.
Anon,
I just took a snapshot off of the realtor tool. However, you can tell from the graph that you would still end up with substantially higher numbers in the more recent months than in previous months. The problem with medians is that if suddenly higher end (or lower end) units start to sell then the median jumps.
“The problem with medians is that if suddenly higher end (or lower end) units start to sell then the median jumps.”
In any one month, yeah, but that’s why you need to use a larger *n*. Referring to the chart, but making up numbers for illustration, if there were 3 sales in April 08 (1200, 1175 and 650) and 5 in each of Feb (725, 700, 695, 675, 650) and March (1425, 1400, 545, 525, 525), then the three month median is 695–exactly the same as the Feb median, and somewhat representative of the overall mix selling, even tho mtm moved around a lot. The m-t-m median is pretty useless w/o knowing the monthly *n*, and the median in general will be easily skewed with small *n* values.
“I just took a snapshot off of the realtor tool.”
Yeah, I didn’t assume it was an excel file, else you likely would have done more with it in the first place.
Anon,
In this case all 8 of the last 8 months are higher than any of the previous 8 months. So the rolling 3 month medians should be higher as well. I think your approach works well to fix a problem with smaller samples where the medians are jumping around a lot from month to month.
The data is distorted the last 8 months due to the sales in 1 Museum Park (1211 S. Prairie.) Here is the data with 3-month rolling medians both with and without the 1 Museum Pk sales:
With 1211 S. Prairie Units
Month Mo Med N 3 Mo Med N
Nov-06 $631,802 18 $627,750 60
Dec-06 $653,510 7 $635,439 40
Jan-07 $590,036 11 $608,250 36
Feb-07 $626,688 6 $600,918 24
Mar-07 $590,000 5 $591,436 22
Apr-07 $549,800 5 $608,081 16
May-07 $815,000 2 $622,500 12
Jun-07 $637,500 14 $650,000 25
Jul-07 $727,500 6 $716,500 26
Aug-07 $606,000 10 $650,000 34
Sep-07 $509,000 5 $562,000 21
Oct-07 $525,000 5 $533,750 20
Nov-07 $582,000 9 $525,000 19
Dec-07 $588,694 5 $582,000 19
Jan-08 $535,000 2 $585,347 16
Feb-08 $689,000 5 $617,500 12
Mar-08 $530,567 18 $615,000 25
Apr-08 $1,175,037 14 $725,000 37
May-08 $899,550 39 $752,500 71
Jun-08 $746,178 22 $908,810 75
Jul-08 $714,200 19 $750,064 80
Aug-08 $873,260 14 $747,274 55
Sep-08 $758,231 19 $749,887 52
Oct-08 $973,060 22 $867,041 55
Nov-08 $1,069,890 7 $973,010 48
Without 1211 S. Prairie Units
Month Mo Med N 3 Mo Med N
Nov-06 $631,802 18 $627,750 60
Dec-06 $653,510 7 $635,439 40
Jan-07 $590,036 11 $608,250 36
Feb-07 $626,688 6 $600,918 24
Mar-07 $590,000 5 $591,436 22
Apr-07 $549,800 5 $608,081 16
May-07 $815,000 2 $622,500 12
Jun-07 $637,500 14 $650,000 25
Jul-07 $727,500 6 $716,500 26
Aug-07 $606,000 10 $650,000 34
Sep-07 $509,000 5 $562,000 21
Oct-07 $525,000 5 $533,750 20
Nov-07 $582,000 9 $525,000 19
Dec-07 $588,694 5 $582,000 19
Jan-08 $535,000 2 $585,347 16
Feb-08 $689,000 5 $617,500 12
Mar-08 $530,567 18 $615,000 25
Apr-08 $467,500 5 $576,250 28
May-08 $661,825 20 $630,648 43
Jun-08 $667,438 14 $660,876 39
Jul-08 $661,526 15 $661,526 49
Aug-08 $725,796 8 $684,092 37
Sep-08 $693,969 11 $704,085 34
Oct-08 $626,610 9 $704,858 28
Nov-08 $753,035 2 $680,957 22
“In this case all 8 of the last 8 months are higher than any of the previous 8 months. So the rolling 3 month medians should be higher as well.”
Yeah, that’s definitely true for this set of data, but it is defintely possible that the 16 month median is almost the same as the median for the first 8 months of the period.
The median (incl 1211 S Prairie) for the first 8 months (11/06-6/07) was $625,581. The median for the first 16 months (11/06-2/08) was $620,000.
So, still generally higher, w/o OMP, but there’s probably some effect from the “comps”.
Since we’re talking numbers–did anyone see that Uncle Sam has decided to work to bring the 30 year fixed down to 4.5%? That should solve all the problems with the housing market, huh? Yijole!
Kenworthey,
Don’t worry Hank Paulson’s ill conceived plans likely won’t have time to be implemented. Hopefully Geitner will have more sense.
Hanky doesn’t seem to understand that low interest rates are part of the problem that got us into this pickle in the first place. Who cares about a 100bp drop in your mortgage rate if you’re buying at a 50% higher price than in 2000?
I almost choked the other day when Hank Paulson was speaking. He said something along the lines of “we need to stop this housing correction”. Now…why would you want to stop a CORRECTION and if it is a correction how COULD you stop it?
G, what is your data source? You seem to have easier access to data than just the MLS.
I think Paulson, being a former CEO of a major Wall Street firm, is unwilling to concede he is a lame duck and incapable of major policy shifts at this point. He has barely over a month left on the job and yet continues to come out with enormous policy proposals almost daily. Including repeatedly embarassing himself by reversing his positions in a matter of days or weeks later.
Truth is like the President noone cares what he thinks anymore and any policies he tries to implement in these final days will likely be hastily reversed by his successors, who probably have more sense.
Gary, from what we can tell, G analyzes the real estate market for a living. My guess is that he assembles it himself from primary sources like Cook County recorder’s office.
I just updated the Near South Side market data through November. Check out the inventory level:
http://lucidrealty.com/near_south_side_market.htm
Number of properties sold plummeted.
Kenworthey, thanks for solving the mystery. Figured he had to have lots of raw data.
Thanks for the update Gary. I fear the November inventory surge is going to get a lot worse before we’re through.
But that is four years worth of inventory! (and you don’t even include 1-bedroom condos in that.)