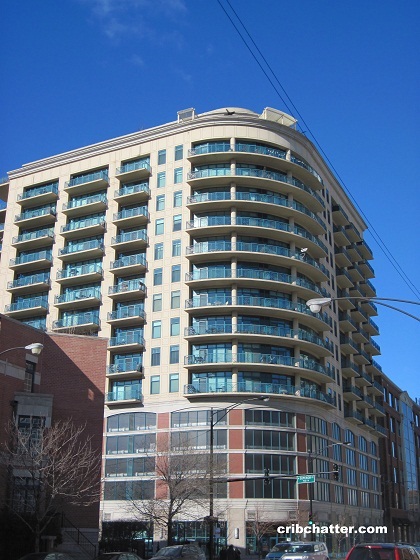
3-Bedroom Full Floor Entertainer’s Dream for $1.275 Million in River North: 60 W. Erie
This 3-bedroom in 60 W. Erie in River North came on the market in September 2022 and was withdrawn in March 2023, before being listed again in February 2024.
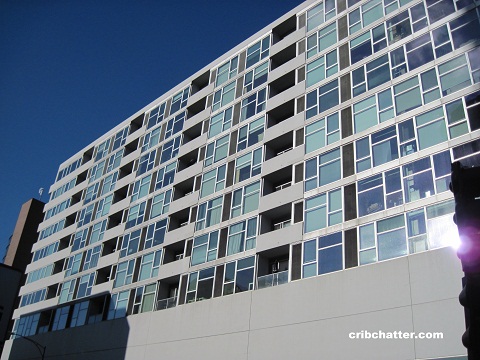
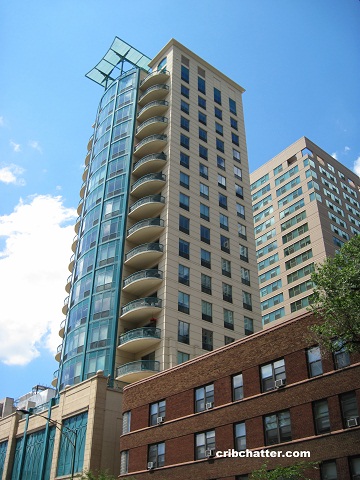
Built in 2002, 60 W. Erie is a boutique building with just 24 units and attached garage parking.
The building has door staff and an exercise room.
This unit is a full floor unit with a private entry elevator foyer.
It has south, west and east views.
The listing says it’s an “entertainer’s dream” with an open concept and floor-to-ceiling windows.
It has a formal dining room and a newly built custom bar with 2 integrated wine fridges.
Finishes throughout were by an interior designer with Ann Sacks tiles, custom draperies and shades, California Closets and wood floors.
The kitchen has been “renovated” and has white cabinets, porcelain tile floors, Subzero refrigerator, Thermador range, an eat-in island with quartz countertops, stainless steel appliances and a balcony with city views.
The bedrooms have a split floor plan with the primary suite in its own wing with a sitting area, a walk-in-closet, an en suite bath with marble chevron floors, and a separate shower and soaking tub. There’s also a double sink vanity with quartz countertops.
The other 2 bedrooms are in the other wing.
There’s also an office.
The unit has the features buyers look for including a side-by-side washer/dryer, central air and 2 car garage parking is available for $25,000 extra (not sure if that is “each” or for both).
The unit has several outdoor spaces, including 2 balconies that face the south and a large, north facing terrace covered with astro turf.
This building is in the middle of all the shops and restaurants of River North and is near the Whole Foods and Trader Joe’s as well as multiple bus lines.
Listed in September 2022 for $1,399,9999, it went under contract that October but then came back on the market.
It was reduced to $1.275 million by March 2023 but was then withdrawn from the market.
The unit has come back on the market this year for $1.275 million plus $25,000 extra for the parking.
At 3400 square feet, is this full floor unit a single family home alternative?
Lital Avnet at Jameson Sotheby’s has the listing. See the pictures and floor plan here.
Unit #601: 3 bedrooms, 2.5 baths, 3400 square feet, full floor
- Sold in November 2005 for $1.298 milion
- Sold in February 2014 for $1.345 million
- Sold in August 2020 for $1.25 million
- Originally listed in September 2022 for $1,399,999
- Under contract in October 2022
- Returned to the market
- Reduced to $1.275 million by March 2023
- Withdrawn
- Re-listed in February 2024 for $1.275 million
- Assessments of $3169 a month (includes heat, gas, doorman, cable, exterior maintenance, lawn care, scavenger, snow removal, internet)
- Taxes of $27,462
- Central Air
- Side-by-side washer/dryer in the unit
- 2-car garage parking for $25,000 (is this each?)
- Bedroom #1: 13×25
- Bedroom #2: 11×19
- Bedroom #3: 11×14
- Dining room: 11×16
- Living room: 27×18
- Kitchen: 17×11
- Office: 12×16
- Balcony (2): 15×5
- Terrace: 35×19